


How to Maximise Reporting to Measure Your Content & PR Efforts in 2023

When discussing online activities such as Digital PR and Content, the ability to assess performance and optimise for these channels is key to ensuring progress and development. Following our recent webinar, this blog seeks to outline how to maximise reporting to measure your Content and PR efforts, using the following 3 pillars:
See the full presentation here.
Deciding your metrics & KPIs
The first phase of any reporting strategy is to agree upon the metrics and KPIs you will be looking to use. This is often the first hurdle where many companies fail, where they try to capture everything possible and then lose focus on the important aspects that they should be paying attention to. Overall, KPIs should be:
- Linked to business & campaign objectives
- Considering both leading & lagging indicators
- Useful for stakeholders to assess performance
- Especially measurable & specific
If your KPIs meet the above criteria, you have taken your first step to gauge performance in a meaningful and actionable way. If not, to guide you in the right direction, we have provided some examples below, which cover some of the most common KPIs we have reported on for clients:

Most commonly, KPIs have a direct influence on the bottom line of the business – put bluntly, ‘money talks’. This could be a lead for a product/service or even just purchasing a product. This is in comparison to something like scroll depth, which is useful to analyse content consumption but is less aligned with KPIs.
I want to finish this section by outlining how every business is different. KPIs from Company A may be completely irrelevant to Company B, and vice versa. This is due to companies having different objectives and requirements based on what they are wanting to achieve. This should mainly be used to provoke thought about what is important to your business.
Measurement and data management
Now the KPIs have been decided, the next phase is to collect and send the data to a tool where it is easy to understand, integrate and visualise. There is a wealth of tools that can be used for this and they can cater to the needs of your business.
There is a range of criteria you should consider when dealing with these sorts of tools; scale, price, functionality and expertise. Google Analytics (GA) is the most common (and typically free) tool which can be used with a variety of integrations. They have worked to make custom events more accessible through Enhanced Measurement, while also ensuring the tool integrates with a wide selection of other business-critical tools.

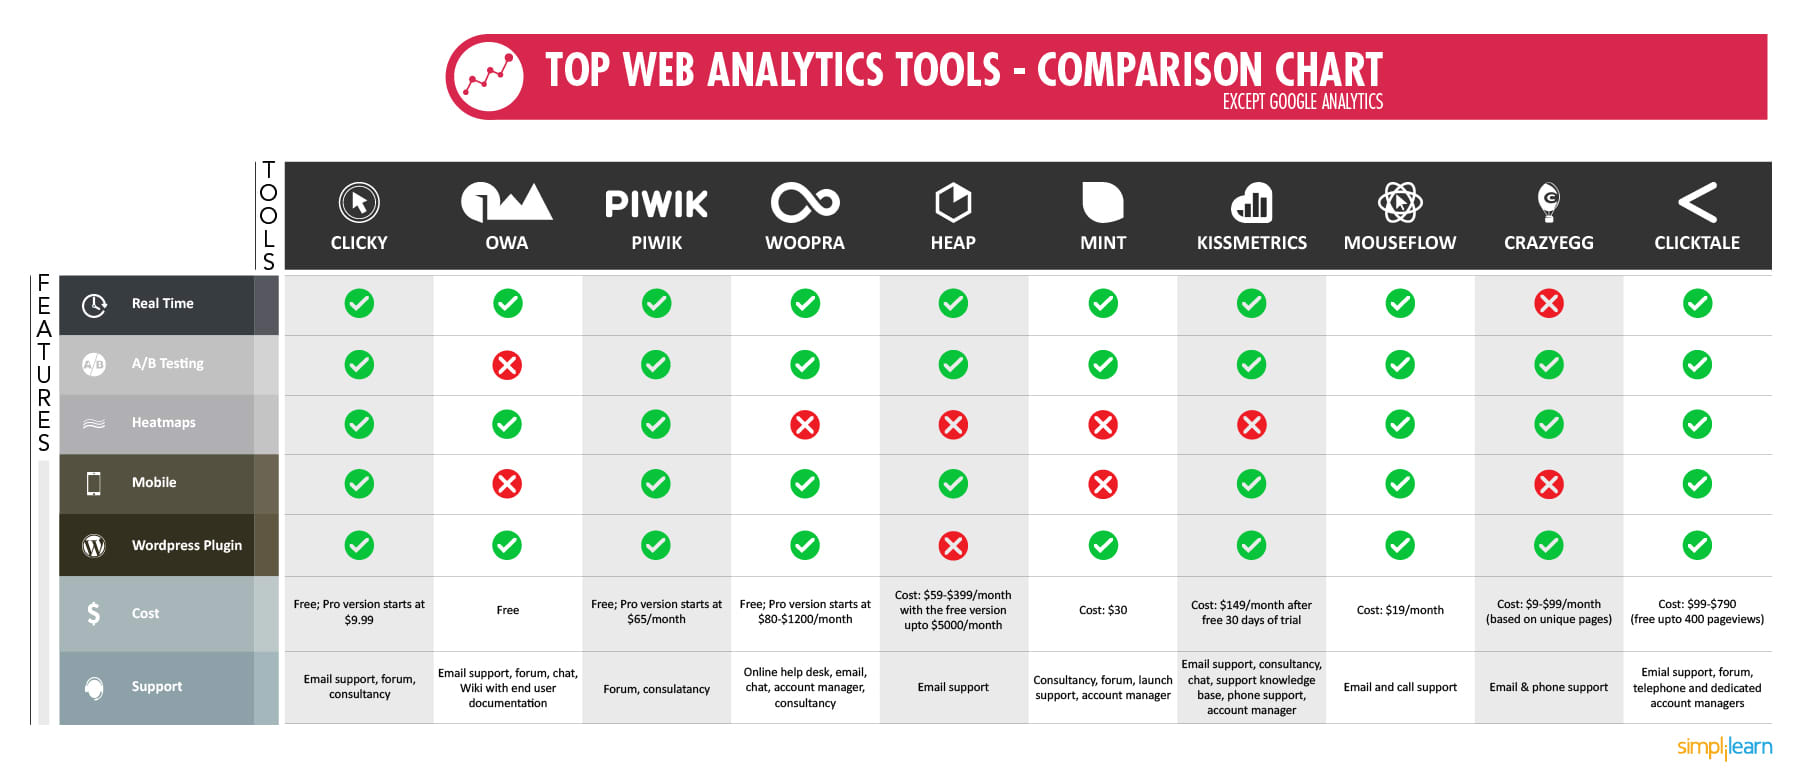
Alternatively, we have created this useful table that gives a comparison of some of the other tools available – but there are plenty more out there!

Each business is different
Once you’ve decided on your destination, we understand that not everyone is a developer and may find it difficult to write code onto the website to achieve certain custom events for more specific KPIs. We, therefore, recommend the use of a tag manager, such as Google Tag Manager (GTM).
This platform, implemented by one main script (and a secondary no-script) can be implemented once on each page while opening up a world of other possibilities – without having to add anything else to the site. GTM gives a more user-friendly interface to implement tracking for a range of native integrations, but also allows the addition of custom HTML tags, which are often provided by tools.

Above is a screenshot from the platform where you can see the structure typically used by GTM, which is a Tag and Trigger that is supplemented by variables. These are used in the following ways:
- Tags – Where you want the data to be sent e.g. Google Ads
- Triggers – When you want the data to be sent – E.g. a form submission
- Variables – The data you want to send
Once you have created a tag, you then have the ability to preview the tracking on your site without pushing live. This means you can fully assess if the setup is correct before rolling it out to all users. We also want to mention that you should consider cookie compliance when implementing tracking and you should do some research before proceeding in this space.
There is also a wide range of great content creators who can help in this area, including Simo Ahava and, of course, us!
Reporting actionable insights
Finally, you have your data collected and stored, but it’s not visually appealing or insightful for those who are less familiar with the tools nor comfortable with data. Data storytelling is a skill in itself as making the insights accessible and actionable makes the data valuable, without this there is no benefit in having the data.
Data should be presented in a logical way that is aligned with your audience. By making the thought process easy to understand and follow, while also delivering the information to make informed decisions, you will get better engagement and results. At Semetrical, ensuring transparency with clients is extremely important when it comes to working collaboratively and maintaining relationships. To achieve this, we often use Looker Studio (previously Data Studio) to transform our data and make it more digestible.
These reports can be made aesthetically pleasing, while also being automated and fully integrated with a range of tools for real-time data that is accessible at all times. A major benefit of this is how a wide range of common connectors are free!

In summary, make sure you know what you want to track and make sure you pick the right solution for your business. If you ever want to chat with one of our experts, get in touch on our site or feel free to reach out on social media.


